by Clark Silcox, NEMA General Counsel
Naturally-Occurring Market Adoption (NOMAD) is a familiar concept in energy conservation regulation. It refers to the proportion of energy savings that would have taken place in the market even if mandatory energy conservation Standards had not been adopted.
That “proportion” is an estimate based on market data and trends.
The NOMAD experience is highly relevant to what has already transpired and is continuing to transpire with respect to light bulbs: while regulation has played a role in reducing electricity use by lighting products over the last 20 years, the market
has accomplished a lot on its own as well and has already done the job that mandatory regulatory Standards could do, particularly for general service lightbulbs.
U.S. Energy Information Administration data documents that lighting has contributed more to U.S. energy conservation than any other electricity- consuming product, reflecting a concordance between lighting innovation, energy conservation, and environmental
protection that is largely a market- driven phenomenon rather than regulation-driven.
As explained below, the estimated additional cost of electricity to a U.S. household because general service incandescent lamps are not eliminated from the market by mandatory regulation is equivalent, on average, to fewer than two chocolate bars per
year in 2023. And the need for more electric power plants in the absence of regulation of general service light bulbs? None. The net difference in domestic utility-scale electricity generation between a regulatory and non-regulatory scenario
for general service light bulbs is less than 1/10th of one percent by 2023.
The trends based on market data are displayed in Figures 1-3. Domestic U.S. shipments of general service incandescent lamps have been naturally declining since 2003, long before any regulatory Standards took effect. At that time, shipments of more efficient
compact fluorescent lamps with a longer socket life were just starting to show significant growth. That growth accelerated in 2007 and continued through 2014; thereafter, shipments of general service light- emitting diode lamps started to accelerate
in 2015.
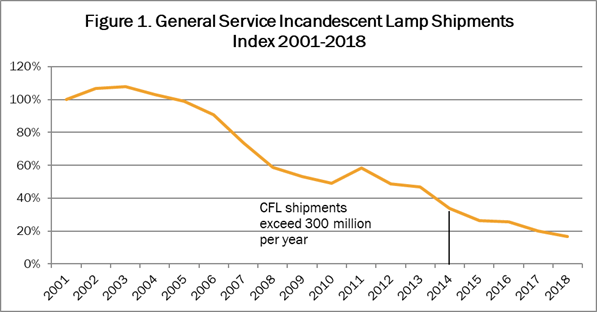
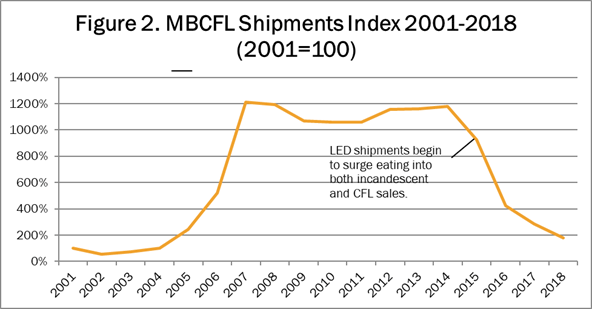
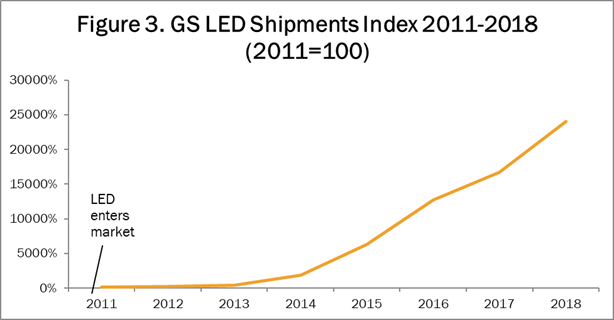
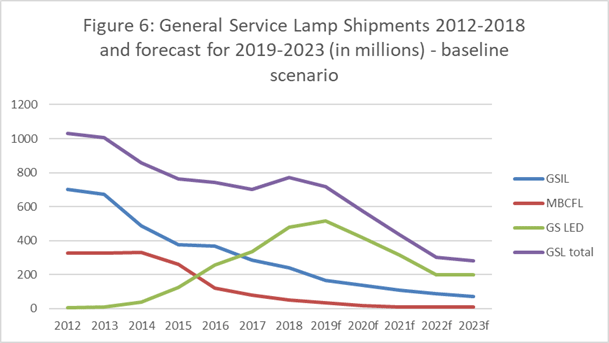
Figure 6 compares the shipments of each of the three technologies of general service lamps since 2012 and includes a forecast through 2023.
Lightbulb shipments tell only part of the story because they are not a direct measure of electricity consumption; lamps in lamp sockets are a more direct measurement of electricity use. Another important input is the service life of the bulb—how
long it resides in a socket. Longer-life CFLs and LEDs crowd out the ability of the shorter-life incandescent bulb to substitute in a socket at any point in time and therefore influence what type of bulb remains in lamp sockets.
We compared the NOMAD scenario to a mandatory energy conservation requirement that could not be met by a general service incandescent lamp (the “ban scenario”). Incandescent light bulbs do not disappear from sockets overnight, but they do
disappear from store shelves sooner and over time from sockets. The estimated socket penetration by the end of 2021 and 2023 under a scenario that banned incandescent lamps at some point in 2020 is shown in the two graphs below.


The ban scenario model results in approximately five percent fewer (5 percent vs. 10 percent) general service incandescent lamps in sockets in 2021 under a regulatory scenario compared to the baseline scenario; by 2023, there are four percent fewer
(two percent vs. six percent) general service incandescent lamps in sockets under a regulatory scenario compared to the baseline scenario. Ultimately shipment data combined with assumptions about lightbulb service life and data-derived lightbulb wattage
enables reasonable estimates of electricity use by these lamps over time.
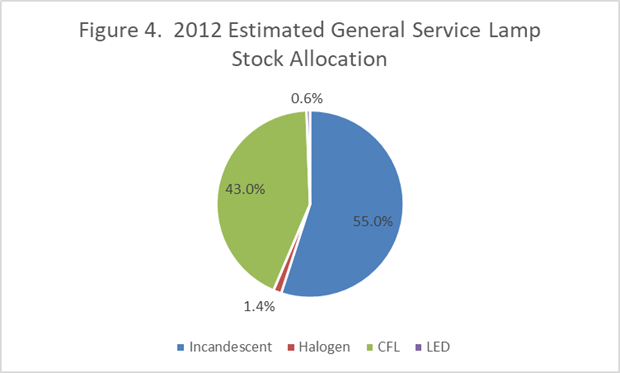
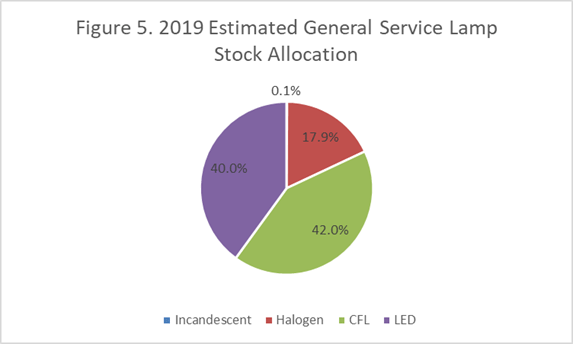
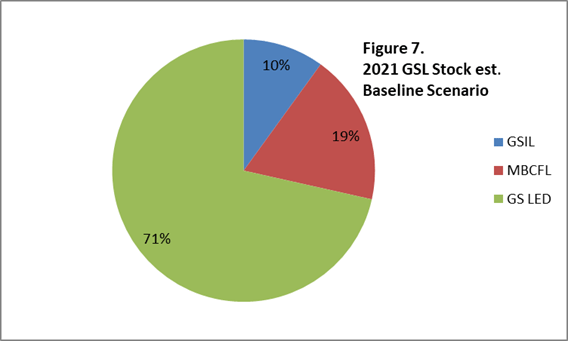

Figures 4, 5, 7, and 10 display the estimates of the installed base showing general service lightbulb socket penetration by technology for 2012, 2019, 2021, and 2023 in the absence of regulation.
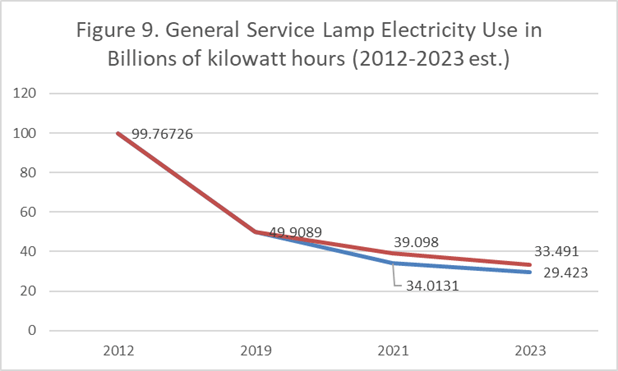
Figure 9 compares the electricity use in the NOMAD scenario (red line) with the ban scenario (blue line). The two scenarios begin to converge by 2023. The graph confirms that most of the energy savings from the adoption of energy-saving lamps has
already occurred. The difference in energy savings between the ban scenario and the baseline scenario results in our net energy savings estimate from regulation of 5.08 billion kilowatt hours by the end of 2021 or 0.116 percent of projected 4.28 trillion kWh utility-scale electricity generation in 2021.
The 5.08 billion kilowatt hours represent only .017 quads of energy, which is about 17/1000th of a percent (0.01683 percent) of the 101 quads of energy consumed in the United States in 2018. Figure 9 projects the difference between the NOMAD scenario and the ban scenario and shows the difference narrowing by the end
of 2023 as the electricity use under the two scenarios begin to converge, with the net difference declining to 4.0 billion kWh between the two scenarios, less than one-tenth of one percent (0.094 percent) of annual utility-scale electricity generation
in 2023.
Electricity use by general service lamps (as a percent of U.S. utility-scale electricity generation) declined by over half from 2.46 percent to 1.19 percent from 2012 to 2019. The NOMAD scenario forecasts an additional decline of 0.28 percent by
2021 while the ban scenario forecasts a decline of 0.4 percent by 2021, a difference of 0.116 percent. The “net” energy savings from the ban scenario after accounting for naturally occurring market adoption is less than one-tenth
of one percent of domestic utility-scale generation in 2023. After 2021, the baseline scenario begins to converge toward the ban scenario and the incremental difference in energy savings year over year from a ban scenario is too small to have an impact
on domestic power plant requirements.
On a household basis, the impact of not regulating is small as well. Dividing the estimated 5.08 billion kilowatt hours of net energy savings in 2021 under the ban scenario by 127.59 million U.S. households yields an average of 39.81 kilowatt hours of
electricity per household in the U.S. in 2021. According to the most recent information from the U.S. Energy Information Administration (EIA), the average electricity usage per household in the United States in 2018 was 10,972 kilowatt hours. 39.81 kilowatt hours represent
approximately 0.0036 percent of the average household electricity use in the United States. At an average price of electricity in the United States of $0.1329 per kilowatt hour, the incremental average household cost of electricity in the baseline
scenario over the regulatory ban scenario in 2021 is $5.29 per year or $0.44 per month.
For 2023, the differential impact between the two scenarios is even smaller. Using the same methodology, the model yields an average household cost of $4.16 per year ($0.34 per month) due to the continuing but dwindling presence of general service incandescent
lamps in household lamp sockets. With private label chocolate candy currently costing about $2.75 per piece, the difference in annual household electricity costs between the two scenarios is less than the cost of two pieces of chocolate candy per
year. ei
A longer version of this article appears on NEMA Currents
.